Multiple Choice
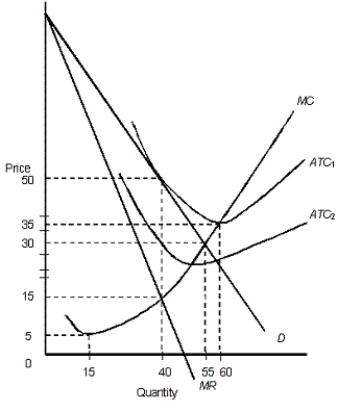
The figure below shows the revenue and cost curves of a monopolistically competitive firm.Figure: 12.2
 In the figure,
D: Demand curve
MR: Marginal revenue curve
ATC1 and ATC2: Average total cost curves
MC: Marginal cost curve
-In the long-run, in a monopolistically competitive market:
A) marginal revenue is greater than average revenue.
B) price equals marginal cost.
C) price equals minimum average total cost.
D) the firms earn positive economic profits.
E) resources are inefficiently allocated .
Correct Answer:

Verified
Correct Answer:
Verified
Q14: The table below shows the payoff (profit)
Q15: The figure given below shows the revenue
Q16: The table below shows the payoff (profit)
Q17: The table below shows the payoff (profit)
Q18: The figure given below shows revenue and
Q20: The table below shows the payoff (profit)
Q21: The table below shows the payoff (profit)
Q22: The figure below shows the revenue and
Q23: The table below shows the payoff (profit)
Q24: The figure given below shows the revenue