True/False
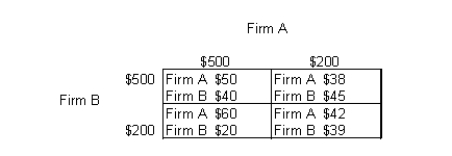
The table below shows the payoff (profit) matrix of Firm A and Firm B indicating the profit outcome that corresponds to each firm's pricing strategy (where $500 and $200 are the pricing strategies of two firms).Table 12.2

-Compared with a perfectly competitive firm in long-run equilibrium, a monopolistically competitive firm will operate on the upward-sloping portion of the average-total-cost curve.
Correct Answer:

Verified
Correct Answer:
Verified
Q18: The figure given below shows revenue and
Q19: The figure below shows the revenue and
Q20: The table below shows the payoff (profit)
Q21: The table below shows the payoff (profit)
Q22: The figure below shows the revenue and
Q24: The figure given below shows the revenue
Q25: The figure given below shows the cost
Q26: The figure given below shows the cost
Q27: The table below shows the payoff (profit)
Q28: The figure given below shows the cost