Multiple Choice
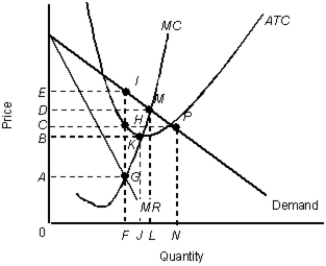
The figure given below shows the revenue and cost curves of a monopolistically competitive firm.Figure 12.4
 MR: Marginal revenue curve
ATC: Average total cost curve
MC: Marginal cost curve
-Oligopoly can arise from:
A) diseconomies of scale in production.
B) limited demand for a product in the market.
C) government regulations.
D) easy availability of the crucial inputs.
E) reduction of trade barriers.
Correct Answer:

Verified
Correct Answer:
Verified
Q59: The table below shows the payoff (profit)
Q60: The table below shows the payoff (profit)
Q61: The figure given below shows the cost
Q62: The table below shows the payoff (profit)
Q63: The figure given below shows the revenue
Q65: The figure given below shows the revenue
Q66: The table below shows the payoff (profit)
Q67: The following table shows the payoff matrix
Q68: The table below shows the payoff (profit)
Q69: The figure given below shows the revenue