Multiple Choice
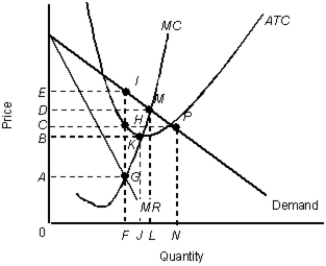
The figure given below shows the revenue and cost curves of a monopolistically competitive firm.Figure 12.4
 MR: Marginal revenue curve
ATC: Average total cost curve
MC: Marginal cost curve
-Firms in monopolistically competitive markets spend significant sums on product differentiation because:
A) it enables them to earn positive profits in the short run.
B) it increases the elasticity of demand for a firm's product.
C) it reduces the number of competitors.
D) it causes the firm's supply curve to become horizontal so the firm can expand output indefinitely.
E) it causes the firm's demand curve to become horizontal so that it can charge a fixed price for its product.
Correct Answer:

Verified
Correct Answer:
Verified
Q64: The figure given below shows the revenue
Q65: The figure given below shows the revenue
Q66: The table below shows the payoff (profit)
Q67: The following table shows the payoff matrix
Q68: The table below shows the payoff (profit)
Q70: The table below shows the payoff (profit)
Q71: The figure given below shows the revenue
Q72: The figure given below shows the cost
Q73: The figure given below shows the revenue
Q74: The table below shows the payoff (profit)