Multiple Choice
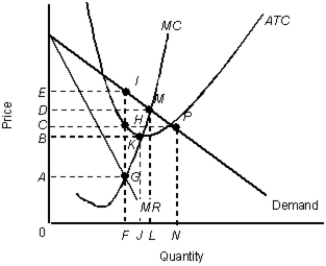
The figure given below shows the revenue and cost curves of a monopolistically competitive firm.Figure 12.4
 MR: Marginal revenue curve
ATC: Average total cost curve
MC: Marginal cost curve
-Wal-Mart created a competitive advantage with its inventory system to reduce the ratio of cost of goods sold to sales, expecting:
A) to enjoy huge economic profits forever.
B) that its rivals will never imitate their strategy and it will continue to enjoy positive economic profits.
C) that its rivals will immediately do the same thing and it will end up earning zero profits.
D) to enjoy economic profits for a few years before its rivals caught up.
E) that it will at least be able to cover its fixed costs.
Correct Answer:

Verified
Correct Answer:
Verified
Q49: The table below shows the payoff (profit)
Q50: The figure given below shows the revenue
Q51: The following table shows the payoff matrix
Q52: The following table shows the payoff matrix
Q53: The table below shows the payoff (profit)
Q55: The table below shows the payoff (profit)
Q56: The table below shows the payoff (profit)
Q57: The figure given below shows the revenue
Q58: The figure given below shows the revenue
Q59: The table below shows the payoff (profit)