True/False
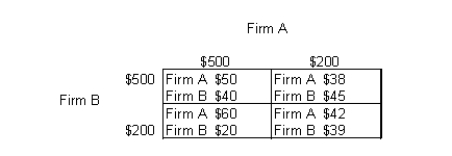
The table below shows the payoff (profit) matrix of Firm A and Firm B indicating the profit outcome that corresponds to each firm's pricing strategy (where $500 and $200 are the pricing strategies of two firms).Table 12.2

-In long-run equilibrium, each monopolistically competitive firm can earn positive economic profits due to economies of scale.
Correct Answer:

Verified
Correct Answer:
Verified
Q69: The figure given below shows the revenue
Q70: The table below shows the payoff (profit)
Q71: The figure given below shows the revenue
Q72: The figure given below shows the cost
Q73: The figure given below shows the revenue
Q75: The figure given below shows the cost
Q76: The figure given below shows the revenue
Q77: The table below shows the payoff (profit)
Q78: The table below shows the payoff (profit)
Q79: The figure given below shows the cost