True/False
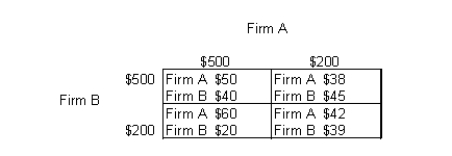
The table below shows the payoff (profit) matrix of Firm A and Firm B indicating the profit outcome that corresponds to each firm's pricing strategy (where $500 and $200 are the pricing strategies of two firms).Table 12.2

-Consumers who are loyal to a brand will purchase products under that brand name even if their prices are above other competing brands.
Correct Answer:

Verified
Correct Answer:
Verified
Q22: The figure below shows the revenue and
Q23: The table below shows the payoff (profit)
Q24: The figure given below shows the revenue
Q25: The figure given below shows the cost
Q26: The figure given below shows the cost
Q28: The figure given below shows the cost
Q29: The figure given below shows the revenue
Q30: The figure given below shows the cost
Q31: The table below shows the payoff (profit)
Q32: The figure given below shows the cost