Multiple Choice
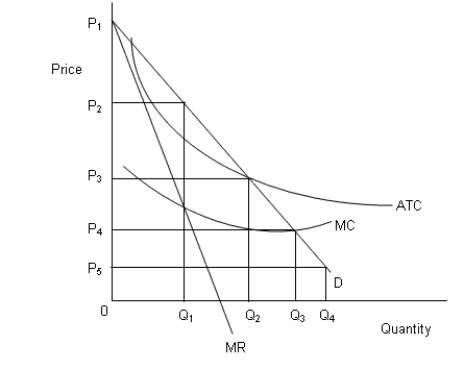
The figure below shows revenue and cost curves of a natural monopoly firm.Figure 14.1
 In the figure,
D: Demand curve
MR: Marginal revenue curve
MC: Marginal cost curve
ATC: Average total cost curve
-When regulating a natural monopoly, government officials face a dilemma that:
A) the efficient price may not allow the firm to break even.
B) the efficient price may lead to an inefficiently high level of output.
C) the efficient price leads to an output level that is too low.
D) the efficient price may force the firm to shut-down.
E) long-run average costs are constantly increasing.
Correct Answer:

Verified
Correct Answer:
Verified
Q52: <img src="https://d2lvgg3v3hfg70.cloudfront.net/TB1748/.jpg" alt=" -In the United
Q53: In the following figure, the first panel
Q54: <img src="https://d2lvgg3v3hfg70.cloudfront.net/TB1748/.jpg" alt=" -The most reliable
Q55: The figure below shows revenue and cost
Q56: <img src="https://d2lvgg3v3hfg70.cloudfront.net/TB1748/.jpg" alt=" -A monopolistic industry
Q58: The figure below shows revenue and cost
Q59: <img src="https://d2lvgg3v3hfg70.cloudfront.net/TB1748/.jpg" alt=" -Which of the
Q60: The figure below shows revenue and cost
Q61: In the following figure, the first panel
Q62: In the following figure, the first panel