Multiple Choice
The following graphic of PCB Failures is a ___. 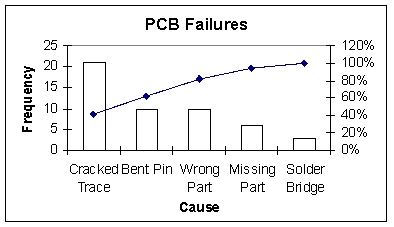
A) scatter Plot
B) Pareto Chart
C) pie chart
D) cumulative histogram chart
E) line diagram
Correct Answer:

Verified
Correct Answer:
Verified
Related Questions
Q3: The cumulative frequency for a class is
Q9: The difference between the highest number and
Q26: Consider the following frequency distribution:
Q31: Abel Alonzo, Director of Human Resources, is
Q67: The 1999 and 2000 market share data
Q72: The 1999 and 2000 market share data
Q74: Describe and construct different types of quantitative
Q78: A person has decided to construct a
Q86: Consider the following stem and leaf plot:
Q104: For any given data set, a frequency