Essay
Exhibit 9.5
The following questions are based on the description and spreadsheet below.
An analyst has identified 3 independent variables (X1, X2,X3) which might be used to predict Y. He has computed the regression equations using all of the variables and the results are summarized in the following table. 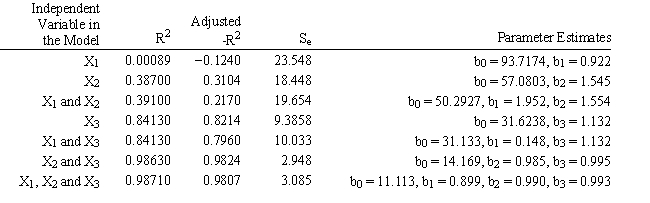
-Refer to Exhibit 9.5. Based on the data in the table which is the best model for the charity to use? Explain which values you used to reach your conclusion.
Correct Answer:

Verified
The model with X2 and...View Answer
Unlock this answer now
Get Access to more Verified Answers free of charge
Correct Answer:
Verified
View Answer
Unlock this answer now
Get Access to more Verified Answers free of charge
Q83: The standard prediction error is<br>A) always smaller
Q84: In regression analysis, the total variation is:<br>A)
Q85: The R<sup>2</sup> statistic<br>A) varies between −1 and
Q86: Which of the following cannot be negative?<br>A)
Q87: Exhibit 9.6<br>The partial regression output below applies
Q89: Exhibit 9.3<br>The following questions are based on
Q90: R<sup>2</sup> is calculated as<br>A) ESS/TSS<br>B) 1 −
Q91: In regression analysis, we consider models
Q92: How many independent variables are there in
Q93: The adjusted R<sup>2</sup> statistic<br>A) is equal to