Essay
Exhibit 9.5
The following questions are based on the description and spreadsheet below.
An analyst has identified 3 independent variables (X1, X2,X3) which might be used to predict Y. He has computed the regression equations using all of the variables and the results are summarized in the following table. 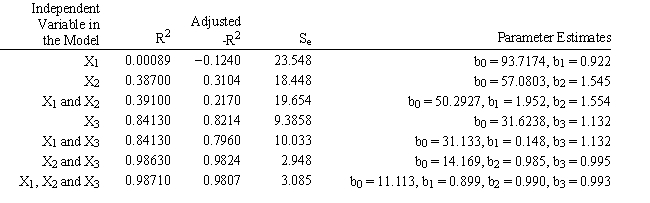
-Refer to Exhibit 9.5. Predict the mean value based on (X1, X2, X3) = (3, 32, 50). Use the best predictive model based on data from the table.
Correct Answer:

Verified
Correct Answer:
Verified
Q25: The company would like to build a
Q26: Exhibit 9.3<br>The following questions are based on
Q27: Exhibit 9.2<br>The following questions are based on
Q28: Which of the following represents a regression
Q29: What is the correct range for R<sup>2</sup>
Q31: A pattern resulting from random variation or
Q32: What is the formula for total sum
Q33: When using the Regression tool in Excel
Q34: Exhibit 9.2<br>The following questions are based on
Q35: Exhibit 9.1<br>The following questions are based on