Multiple Choice
Figure 3-2 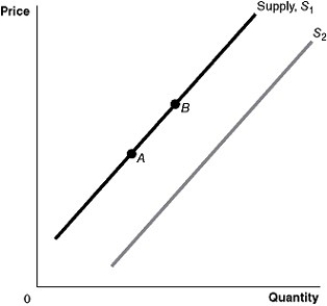
-Refer to Figure 3-2. A decrease in productivity would be represented by a movement from
A) A to B.
B) B to A.
C) S1 to S2.
D) S2 to S1.
Correct Answer:

Verified
Correct Answer:
Verified
Related Questions
Q25: The decline in the popularity of clothing
Q33: Figure 3-8 <img src="https://d2lvgg3v3hfg70.cloudfront.net/TB7397/.jpg" alt="Figure 3-8
Q34: Assume that California Merlot is a normal
Q92: If the demand curve for a product
Q104: Figure 3-1 <img src="https://d2lvgg3v3hfg70.cloudfront.net/TB1236/.jpg" alt="Figure 3-1
Q118: Assume that both the demand curve and
Q170: Using Richard Tedlow's "three phases of marketing,"
Q180: Assume that the price for swimming pool
Q189: In October 2005, the U.S.Fish and Wildlife
Q191: Would a change in the price of