Essay
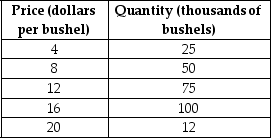
Use the following supply schedule for cherries to draw a graph of the supply curve.Be sure to label the supply curve and each axis,and show each point on the supply curve.
Correct Answer:

Verified
Correct Answer:
Verified
Q54: Last year, the Pottery Palace supplied 8,000
Q57: A change in which variable will change
Q83: Figure 3-8 <img src="https://d2lvgg3v3hfg70.cloudfront.net/TB4181/.jpg" alt="Figure 3-8
Q91: Figure 3-8 <img src="https://d2lvgg3v3hfg70.cloudfront.net/TB4181/.jpg" alt="Figure 3-8
Q159: Figure 3-5<br> <img src="https://d2lvgg3v3hfg70.cloudfront.net/TB4193/.jpg" alt="Figure 3-5
Q167: A decrease in the demand for incandescent
Q209: Olive oil producers want to sell more
Q232: Figure 3-7<br> <img src="https://d2lvgg3v3hfg70.cloudfront.net/TB4193/.jpg" alt="Figure 3-7
Q278: Figure 3-6 <img src="https://d2lvgg3v3hfg70.cloudfront.net/TB4188/.jpg" alt="Figure 3-6
Q305: If the Apple iPhone and the Samsung