Multiple Choice
Figure 3-8 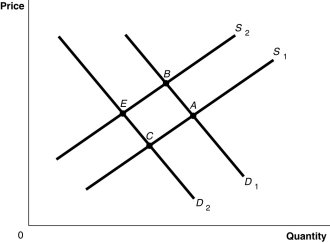
-Refer to Figure 3-8.The graph in this figure illustrates an initial competitive equilibrium in the market for apples at the intersection of D1 and S1 (point A) .If there is a shortage of apples how will the equilibrium point change?
A) The equilibrium point will move from A to B.
B) The equilibrium point will move from A to C.
C) There will be no change in the equilibrium point.
D) The equilibrium point will move from A to E.
Correct Answer:

Verified
Correct Answer:
Verified
Q32: Which of the following would shift the
Q54: Last year, the Pottery Palace supplied 8,000
Q87: Use the following supply schedule for cherries
Q92: A decrease in the demand for soft
Q159: Figure 3-5<br> <img src="https://d2lvgg3v3hfg70.cloudfront.net/TB4193/.jpg" alt="Figure 3-5
Q167: A decrease in the demand for incandescent
Q194: Figure 3-2 <img src="https://d2lvgg3v3hfg70.cloudfront.net/TB7397/.jpg" alt="Figure 3-2
Q209: Olive oil producers want to sell more
Q215: Suppose that when the price of hamburgers
Q305: If the Apple iPhone and the Samsung