Multiple Choice
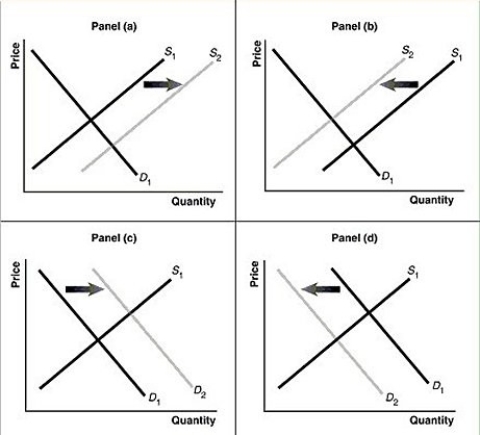
Figure 3-7

-Refer to Figure 3-7.Assume that the graphs in this figure represent the demand and supply curves for women's clothing.Which panel best describes what happens in this market when the wages of seamstresses rise?
A) Panel (a)
B) Panel (b)
C) Panel (c)
D) Panel (d)
Correct Answer:

Verified
Correct Answer:
Verified
Q105: If the population increases and input prices
Q106: Figure 3-5<br> <img src="https://d2lvgg3v3hfg70.cloudfront.net/TB4193/.jpg" alt="Figure 3-5
Q107: A supply schedule<br>A)is a table that shows
Q108: Table 3-1<br> <img src="https://d2lvgg3v3hfg70.cloudfront.net/TB4193/.jpg" alt="Table 3-1
Q109: "Because apples and oranges are substitutes, an
Q111: Figure 3-2<br> <img src="https://d2lvgg3v3hfg70.cloudfront.net/TB4193/.jpg" alt="Figure 3-2
Q112: An increase in the price of off-road
Q113: Technological advancements have led to lower prices
Q114: Draw a supply and demand graph showing
Q115: Table 3-3<br> <img src="https://d2lvgg3v3hfg70.cloudfront.net/TB4193/.jpg" alt="Table 3-3