Multiple Choice
Table 5.4 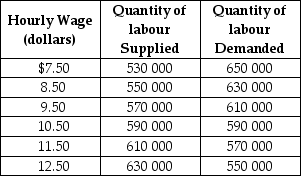 Table 5-4 shows the demand and supply schedules for labour market in the city of Pixley.
-Refer to Table 5.4.Suppose that the quantity of labour demanded decreases by 80 000 at each wage level.What are the new free market equilibrium hourly wage and the new equilibrium quantity of labour?
A) W = $8.50; Q = 550 000
B) W = $12.50; Q = 630 000
C) W = $9.50; Q = 570 000
D) W = $9.50; Q = 590 000
Correct Answer:

Verified
Correct Answer:
Verified
Q59: One result of a tax is an
Q83: Marginal benefit is the total benefit to
Q133: Arthur buys a new mobile phone for
Q134: The graph below represents the market for
Q135: Economic efficiency is a market outcome in
Q136: A minimum wage law dictates<br>A)the minimum quantity
Q142: Figure 5.5 <img src="https://d2lvgg3v3hfg70.cloudfront.net/TB1015/.jpg" alt="Figure 5.5
Q143: Figure 5.5 <img src="https://d2lvgg3v3hfg70.cloudfront.net/TB1015/.jpg" alt="Figure 5.5
Q197: Using a supply and demand graph, illustrate
Q207: Economic surplus<br>A)does not exist when a competitive