Multiple Choice
Figure 9.2 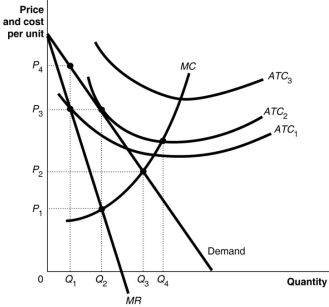 Figure 9.2 above shows the demand and cost curves facing a monopolist.
-Refer to Figure 9.2.To maximise profit, the firm will produce
A) Q1.
B) Q2.
C) Q3.
D) Q4.
Correct Answer:

Verified
Correct Answer:
Verified
Q51: A local electricity-generating company has a monopoly
Q90: Figure 9.4 <img src="https://d2lvgg3v3hfg70.cloudfront.net/TB1015/.jpg" alt="Figure 9.4
Q91: Table 9.1 <img src="https://d2lvgg3v3hfg70.cloudfront.net/TB1015/.jpg" alt="Table 9.1
Q92: Figure 9.4 <img src="https://d2lvgg3v3hfg70.cloudfront.net/TB1015/.jpg" alt="Figure 9.4
Q92: Assume a hypothetical case where an industry
Q93: Figure 9.4 <img src="https://d2lvgg3v3hfg70.cloudfront.net/TB1015/.jpg" alt="Figure 9.4
Q97: Why does a monopoly cause a deadweight
Q98: Figure 9.5 <img src="https://d2lvgg3v3hfg70.cloudfront.net/TB1015/.jpg" alt="Figure 9.5
Q99: A monopoly is defined as a firm
Q256: A monopoly is a seller of a