Multiple Choice
Figure 9.3 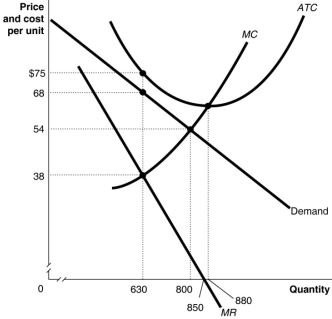 Figure 9.3 above shows the demand and cost curves facing a monopolist.
-Refer to Figure 9.3.What happens to the monopolist represented in the diagram in the long run?
A) It will raise its price at least until it breaks even.
B) If the cost and demand curves remain the same, it will exit the market.
C) The government will subsidise the monopoly to enable it to break even.
D) It will be forced out of business by more efficient producers.
Correct Answer:

Verified
Correct Answer:
Verified
Q6: The demand curve for a monopoly firm<br>A)is
Q90: A vertical merger is one that takes
Q118: Suppose a monopoly is producing its profit-maximising
Q120: If a monopolist engages in first-degree price
Q121: With perfect price discrimination, which of the
Q122: Figure 9.9 <img src="https://d2lvgg3v3hfg70.cloudfront.net/TB1015/.jpg" alt="Figure 9.9
Q126: There are several types of barriers to
Q143: If a per-unit tax on output sold
Q164: Which of the following is not a
Q246: A patent<br>A) grants the creator of a