Multiple Choice
Figure 16.2 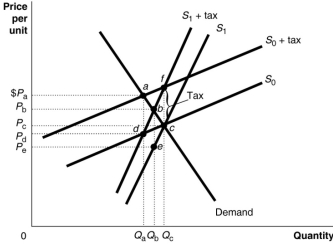 Figure 16.2 shows a demand curve and two sets of supply curves, one set more elastic than the other.
-Refer to Figure 16.2.If the government imposes an excise tax of $1.00 on every unit sold, the producer's burden of the tax
A) is greater under the more elastic supply curve S0.
B) is greater under the less elastic supply curve S0.
C) is greater under the less elastic supply curve S1.
D) is the same under either supply curve because there is a single demand curve that captures buyers' market behaviour.
Correct Answer:

Verified
Correct Answer:
Verified
Q13: Figure 16.1 <img src="https://d2lvgg3v3hfg70.cloudfront.net/TB1015/.jpg" alt="Figure 16.1
Q15: Figure 16.1 <img src="https://d2lvgg3v3hfg70.cloudfront.net/TB1015/.jpg" alt="Figure 16.1
Q22: Figure 16.3 <img src="https://d2lvgg3v3hfg70.cloudfront.net/TB1015/.jpg" alt="Figure 16.3
Q23: Figure 16.7 <img src="https://d2lvgg3v3hfg70.cloudfront.net/TB1015/.jpg" alt="Figure 16.7
Q28: The "ability-to-pay" principle of taxation is the
Q133: What is meant by "tax incidence"?
Q140: Horizontal equity is achieved when taxes are
Q156: The idea that two taxpayers in the
Q212: If grocery stores were legally required to
Q222: If you pay $3,000 in taxes on