Multiple Choice
Figure 3-1 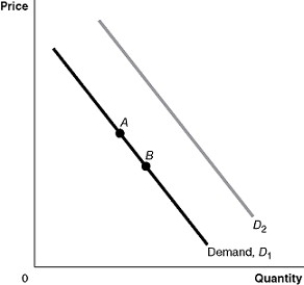
-Refer to Figure 3-1.An increase in taste or preference would be represented by a movement from
A) A to B.
B) B to A.
C) D1 to D2.
D) D2 to D1.
Correct Answer:

Verified
Correct Answer:
Verified
Related Questions
Q12: Assume that the hourly price for the
Q30: A _ demand curve for shampoo would
Q97: Figure 3-3<br> <img src="https://d2lvgg3v3hfg70.cloudfront.net/TB4193/.jpg" alt="Figure 3-3
Q107: A surplus occurs when the market price
Q132: Assume that the demand curve for DVD
Q148: If pilots and flight attendants agree to
Q179: The cost of producing cigarettes in the
Q185: If the Apple Watch and the Samsung
Q189: A firm must devote people, time, and
Q206: According to the Australian Wool Innovation,severe drought