Multiple Choice
Table 20-7
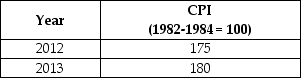
-Refer to Table 20-7. Suppose that the data in the table above reflect price levels in the economy. What is the inflation rate between 2012 and 2013?
A) 2.9%
B) 3.5%
C) 4.6%
D) 5%
E) 7.5%
Correct Answer:

Verified
Correct Answer:
Verified
Q14: Monthly expenditures for a family of 4
Q41: Upon your graduation from college,you find that
Q51: Table 20-19<br> <img src="https://d2lvgg3v3hfg70.cloudfront.net/TB4188/.jpg" alt="Table 20-19
Q53: Table 20-18<br> <img src="https://d2lvgg3v3hfg70.cloudfront.net/TB4188/.jpg" alt="Table 20-18
Q58: Describe how inflation can be costly even
Q105: Explain how the CPI is constructed.
Q159: Suppose that homemakers are included as employed
Q164: Most economists believe that the biases in
Q225: Between 2013 and 2014,the CPI of a
Q271: The unemployment rate in the United States