Multiple Choice
Table 20-18
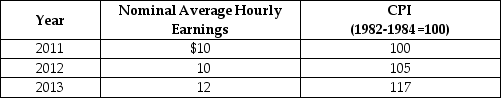
-Refer to Table 20-18. Looking at the table above, what is the rate of growth of real average hourly earnings from 2012 to 2013?
A) 7.7%
B) 6.25%
C) 4%
D) -4%
Correct Answer:

Verified
Correct Answer:
Verified
Q14: Monthly expenditures for a family of 4
Q49: Table 20-7<br> <img src="https://d2lvgg3v3hfg70.cloudfront.net/TB4188/.jpg" alt="Table 20-7
Q51: Table 20-19<br> <img src="https://d2lvgg3v3hfg70.cloudfront.net/TB4188/.jpg" alt="Table 20-19
Q58: Describe how inflation can be costly even
Q58: Table 20-20<br> <img src="https://d2lvgg3v3hfg70.cloudfront.net/TB4188/.jpg" alt="Table 20-20
Q114: Suppose you obtain a fixed rate mortgage
Q164: Most economists believe that the biases in
Q165: Efficiency wage is another name for the
Q225: Between 2013 and 2014,the CPI of a
Q257: An increase in cyclical unemployment will result