Multiple Choice
Figure 2-15 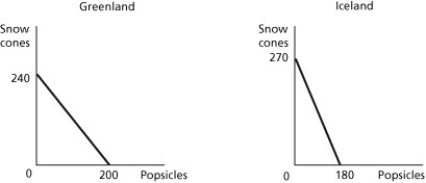 Figure 2-15 shows the production possibilities frontiers for Greenland and Iceland. Each country produces two goods, snow cones and popsicles.
-Refer to Figure 2-15. What is the opportunity cost of producing 1 snow cone in Iceland?
A) 2/3 of a popsicle
B) 3/4 of a popsicle
C) 1 1/2 popsicles
D) 180 popsicles
Correct Answer:

Verified
Correct Answer:
Verified
Q70: Figure 2-8<br> <img src="https://d2lvgg3v3hfg70.cloudfront.net/TB4193/.jpg" alt="Figure 2-8
Q126: If a country is producing efficiently and
Q189: Figure 2-4 <img src="https://d2lvgg3v3hfg70.cloudfront.net/TB1236/.jpg" alt="Figure 2-4
Q199: Table 2-17<br> <img src="https://d2lvgg3v3hfg70.cloudfront.net/TB7397/.jpg" alt="Table 2-17
Q206: The opportunity cost of taking a semester-long
Q208: Figure 2-4 <img src="https://d2lvgg3v3hfg70.cloudfront.net/TB1236/.jpg" alt="Figure 2-4
Q438: Table 2-15<br> <img src="https://d2lvgg3v3hfg70.cloudfront.net/TB4188/.jpg" alt="Table 2-15
Q441: Figure 2-3 <img src="https://d2lvgg3v3hfg70.cloudfront.net/TB4188/.jpg" alt="Figure 2-3
Q442: Figure 2-16 <img src="https://d2lvgg3v3hfg70.cloudfront.net/TB4188/.jpg" alt="Figure 2-16
Q445: On a diagram of a production possibility