Multiple Choice
Figure 2-16 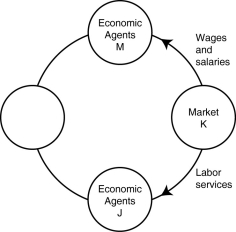
-Refer to Figure 2-16. One segment of the circular flow diagram in the figure shows the flow of labor services from market K to economic agents J. What is market K and who are economic agents J?
A) K = factor markets; J = households
B) K = product markets; J = households
C) K = factor markets; J = firms
D) K = product markets; J = firms
Correct Answer:

Verified
Correct Answer:
Verified
Q17: Scarcity<br>A)stems from the incompatibility between limited resources
Q70: Figure 2-8<br> <img src="https://d2lvgg3v3hfg70.cloudfront.net/TB4193/.jpg" alt="Figure 2-8
Q126: If a country is producing efficiently and
Q199: Table 2-17<br> <img src="https://d2lvgg3v3hfg70.cloudfront.net/TB7397/.jpg" alt="Table 2-17
Q206: The opportunity cost of taking a semester-long
Q438: Table 2-15<br> <img src="https://d2lvgg3v3hfg70.cloudfront.net/TB4188/.jpg" alt="Table 2-15
Q440: Figure 2-15 <img src="https://d2lvgg3v3hfg70.cloudfront.net/TB4188/.jpg" alt="Figure 2-15
Q441: Figure 2-3 <img src="https://d2lvgg3v3hfg70.cloudfront.net/TB4188/.jpg" alt="Figure 2-3
Q445: On a diagram of a production possibility
Q479: Figure 2-5 <img src="https://d2lvgg3v3hfg70.cloudfront.net/TB3018/.jpg" alt="Figure 2-5