Essay
Figure 18-9 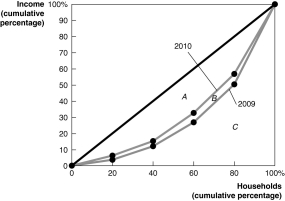
-Refer to Figure 18-9 to answer the following questions.
a. Did the distribution of income become more equal in 2010 that it was in 2009, or did it become less equal? Explain.
b. If area A = 1,600, area B = 200, and area C = 3,200, calculate the Gini coefficient for 2009 and the Gini coefficient for 2010.
Correct Answer:

Verified
a. The distribution of income became mor...View Answer
Unlock this answer now
Get Access to more Verified Answers free of charge
Correct Answer:
Verified
View Answer
Unlock this answer now
Get Access to more Verified Answers free of charge
Q20: The poverty rate is defined as the
Q39: When members of Congress vote to pass
Q44: A Gini coefficient of _ means that
Q69: If the marginal tax rate is less
Q118: Since lower-income people spend a larger proportion
Q145: The excess burden of a tax<br>A)measures the
Q159: Figure 18-6<br> <img src="https://d2lvgg3v3hfg70.cloudfront.net/TB4193/.jpg" alt="Figure 18-6
Q203: What is the relationship between market failure
Q221: Table 18-2<br> <img src="https://d2lvgg3v3hfg70.cloudfront.net/TB4193/.jpg" alt="Table 18-2
Q257: Figure 18-4<br> <img src="https://d2lvgg3v3hfg70.cloudfront.net/TB4193/.jpg" alt="Figure 18-4