Essay
Figure 13-6
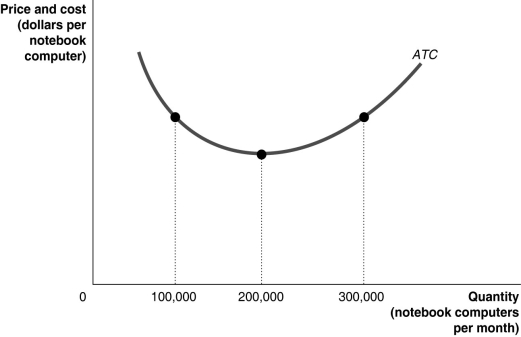
-Refer to Figure 13-6.Suppose the above graph represents the relationship between the average total cost of producing notebook computers and the quantity of notebook computers produced by Dell.On a graph, illustrate the demand, MR, MC, and ATC curves which would represent Dell maximizing profits at a quantity of 100,000 per month and identify the area on the graph which represents the profit.
Correct Answer:

Verified
Correct Answer:
Verified
Q216: Is a monopolistically competitive firm allocatively efficient?<br>A)No,
Q217: Assuming that the total market size remains
Q218: In both monopolistically competitive and perfectly competitive
Q219: Suppose that if a local McDonald's restaurant
Q220: Figure 13-4<br> <img src="https://d2lvgg3v3hfg70.cloudfront.net/TB4193/.jpg" alt="Figure 13-4
Q222: Assume that price exceeds average variable cost
Q223: Economists have long debated whether there is
Q224: Compared to a perfectly competitive firm, the
Q225: A monopolistically competitive firm earning profits in
Q226: One of your classmates asserts that advertising,