Multiple Choice
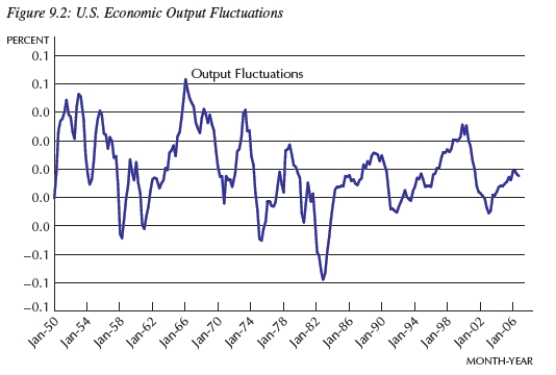
-Consider Figure 9.2,which represents 
t.In approximately what years did the U.S.economy experience its longest economic downturn,using the text's definition?
A) 1990-1997
B) 1974-1978
C) 1980-1988
D) 1957-1963
E) cannot be determined from the information given
Correct Answer:

Verified
Correct Answer:
Verified
Q17: A decline in long-term productivity implies that
Q45: The Phillips curve shows the negative relationship
Q59: Output fluctuations are defined as:<br>A) the amount
Q60: Defining Yt as current output, <img src="https://d2lvgg3v3hfg70.cloudfront.net/TB4305/.jpg"
Q61: Which of the following is not an
Q62: <img src="https://d2lvgg3v3hfg70.cloudfront.net/TB4305/.jpg" alt=" -The table below
Q67: <img src="https://d2lvgg3v3hfg70.cloudfront.net/TB4305/.jpg" alt=" -Consider the Phillips
Q70: In 1980,the inflation rate reached about 14
Q77: Generally speaking, the rate of inflation rises
Q81: The relationship between actual output in an