Essay
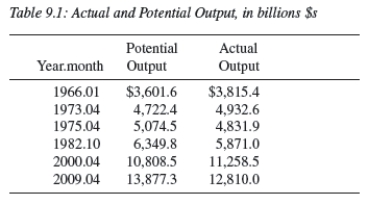
-The table below displays the United States' potential and actual output for six select months between 1960 and 2009.In which month does the economy have the largest expansionary gap? Largest recessionary gap?
Table 9.1: Actual and Potential Output,in billions $s
Correct Answer:

Verified
We use the equation:  From thi...
View Answer
Unlock this answer now
Get Access to more Verified Answers free of charge
Correct Answer:
Verified
View Answer
Unlock this answer now
Get Access to more Verified Answers free of charge
Q45: The Phillips curve shows the negative relationship
Q57: Current output is defined as _.<br>A)the amount
Q59: Which of the following is not an
Q60: Defining Yt as current output, <img src="https://d2lvgg3v3hfg70.cloudfront.net/TB4305/.jpg"
Q60: What does Okun's law state?
Q61: Which of the following is not an
Q65: <img src="https://d2lvgg3v3hfg70.cloudfront.net/TB4305/.jpg" alt=" -Consider Figure 9.2,which
Q67: <img src="https://d2lvgg3v3hfg70.cloudfront.net/TB4305/.jpg" alt=" -Consider the Phillips
Q77: Generally speaking, the rate of inflation rises
Q81: The relationship between actual output in an