Multiple Choice
Use the figure below for the following questions;it shows the BAA corporate and 10-Year Treasury Bond yields. 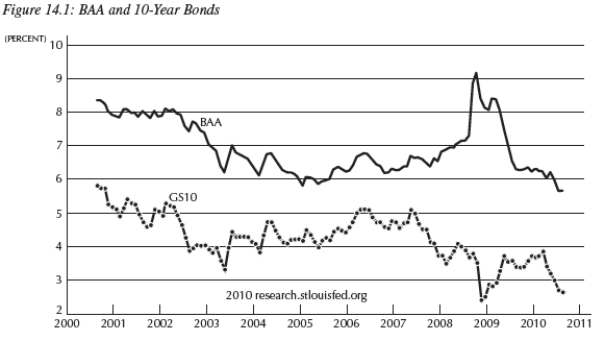
-Consider Figure 14.1 above.The difference between these two curves can be interpreted as:
A) the risk premium.
B) inflation expectations.
C) the risk-free rate.
D) a market imperfection.
E) the prime lending rate.
Correct Answer:

Verified
Correct Answer:
Verified
Q46: To identify an asset bubble, economists and
Q58: In response to the Great Recession, the
Q75: When inflation is negative it:<br>A)raises the real
Q76: You are a newly hired reporter for
Q77: <img src="https://d2lvgg3v3hfg70.cloudfront.net/TB4305/.jpg" alt=" -Consider Figure 14.5
Q78: In the AS/AD framework,the risk premium appears
Q79: In the aftermath of the financial crisis
Q81: In a paper by Minneapolis Fed bank
Q83: The Squam Lake Group is a group
Q85: The burst of the housing bubble can