Multiple Choice
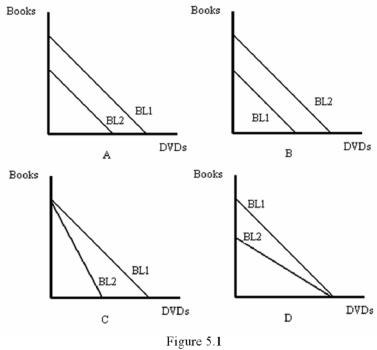
-Refer to Figure 5.1.Which graph represents an increase in the consumer's income?
A) A
B) B
C) C
D) D
Correct Answer:

Verified
Correct Answer:
Verified
Related Questions
Q18: Suppose a consumer buy books and DVDs.The
Q20: <img src="https://d2lvgg3v3hfg70.cloudfront.net/TB1639/.jpg" alt=" -Refer to Figure
Q22: According to the No-Overlap Rule,<br>A) The area
Q23: A curve that describes the relationship between
Q24: If the income-consumption path slopes down,then<br>A) Both
Q28: <img src="https://d2lvgg3v3hfg70.cloudfront.net/TB1639/.jpg" alt=" -When the price
Q30: Suppose that soup is measured on the
Q30: A utility function is a mathematical function
Q44: Using a carefully-labeled diagram,explain an Engel curve
Q64: Which of the following statements is true?<br>A)