Multiple Choice
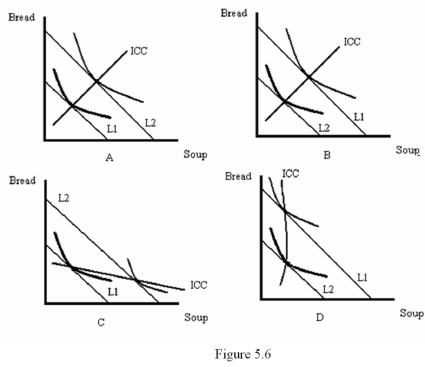
-Refer to Figure 5.6.Which diagram shows an increase in income with bread being inferior and soup being normal?
A) A
B) B
C) C
D) D
Correct Answer:

Verified
Correct Answer:
Verified
Related Questions
Q15: <img src="https://d2lvgg3v3hfg70.cloudfront.net/TB1639/.jpg" alt=" -Refer to Figure
Q16: When indifference curves have _ marginal rates
Q17: If a change in the price of
Q18: Consumption bundles that lie above the boundary
Q19: If prices and income all change by
Q22: According to the No-Overlap Rule,<br>A) The area
Q23: A curve that describes the relationship between
Q24: If the income-consumption path slopes down,then<br>A) Both
Q25: <img src="https://d2lvgg3v3hfg70.cloudfront.net/TB1639/.jpg" alt=" -Refer to Figure
Q44: Using a carefully-labeled diagram,explain an Engel curve