Multiple Choice
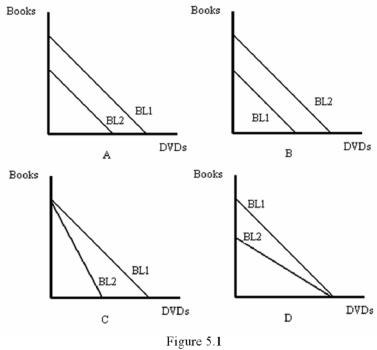
-Refer to Figure 5.1.Which graph represents an increase in the price of DVDs?
A) A
B) B
C) C
D) D
Correct Answer:

Verified
Correct Answer:
Verified
Related Questions
Q2: A curve that shows how the best
Q3: Suppose a consumer purchases pizza and soft
Q4: Choices that do not exhaust the consumer's
Q5: An increase in a consumer's income will
Q6: Stewie spends all of his income on
Q7: An increase in the price of the
Q8: A consumer's budget constraint is determined by<br>A)
Q9: An increase in the price of the
Q10: At a boundary choice,<br>A) The tangency condition
Q11: The revealed preference approach refers to<br>A) Asking