Multiple Choice
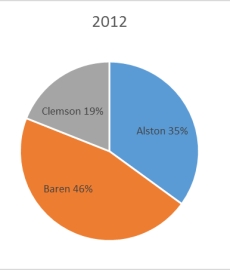
The 2010 and 2012 market share data of the three competitors (Alston,Baren,and Clemson) in an oligopolistic industry are presented in the following pie charts. Total sales for this industry were $1.5 billion in 2010 and $1.8 billion in 2012.Baren's sales in 2010 were ___________. 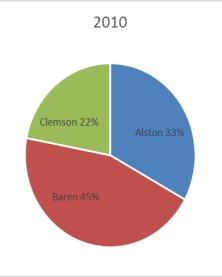
A) $342 million
B) $630 million
C) $675 million
D) $828 million
E) $928 million
Correct Answer:

Verified
Correct Answer:
Verified
Q48: A scatter plot is a two-dimensional graph
Q61: Pinky Bauer,Chief Financial Officer of Harrison Haulers,Inc.,suspects
Q63: A recent survey of U.S.automobile owners showed
Q64: Consider the following stem and leaf plot:
Q65: Pinky Bauer,Chief Financial Officer of Harrison Haulers,Inc.,suspects
Q67: The staff of Ms.Tamara Hill,VP of technical
Q68: A cumulative frequency distribution provides a running
Q70: The following graphic of residential housing data
Q78: A person has decided to construct a
Q93: A frequency distribution was developed.The lower endpoint