Multiple Choice
The following graphic of residential housing data (selling price and size in square feet) is a _____________. 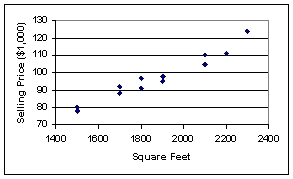
A) scatter plot
B) Pareto chart
C) pie chart
D) cumulative histogram
E) cumulative frequency distribuion
Correct Answer:

Verified
Correct Answer:
Verified
Q48: A scatter plot is a two-dimensional graph
Q65: Pinky Bauer,Chief Financial Officer of Harrison Haulers,Inc.,suspects
Q66: The 2010 and 2012 market share data
Q67: The staff of Ms.Tamara Hill,VP of technical
Q68: A cumulative frequency distribution provides a running
Q72: Consider the following frequency distribution: <img src="https://d2lvgg3v3hfg70.cloudfront.net/TB6468/.jpg"
Q74: Suppose a market survey of 200 consumers
Q75: Each day,the manager at Jamie's Auto Care
Q78: A person has decided to construct a
Q108: A graphical representation of a frequency distribution