menu-iconExamlexExamLexServices

Discover

Ask a Question
  1. All Topics
  2. Topic
    Business
  3. Study Set
    Fundamental Managerial Accounting Concepts Study Set 1
  4. Exam
    Exam 5: Cost Management in an Automated Business Environment: ABC, ABM, and TQM
  5. Question
    In the Below Graph,which Shows the Relationship Among Components of Quality
Solved

In the Below Graph,which Shows the Relationship Among Components of Quality

Question 18

Question 18

Multiple Choice

In the below graph,which shows the relationship among components of quality cost,Line "C" depicts:
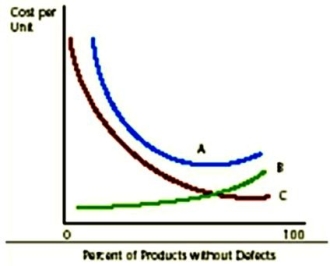
 In the below graph,which shows the relationship among components of quality cost,Line  C  depicts:   A)  failure costs. B)  internal quality cost. C)  voluntary quality failure costs. D)  prevention costs.


A) failure costs.
B) internal quality cost.
C) voluntary quality failure costs.
D) prevention costs.

Correct Answer:

verifed

Verified

Unlock this answer now
Get Access to more Verified Answers free of charge

Related Questions

Q13: Morris Company allocates overhead based on direct

Q14: Roadmaster Tires produces a variety of auto

Q15: Downstream costs are not relevant to a

Q16: What is the likely consequence of using

Q17: In a highly automated manufacturing company,labor costs

Q19: What is the principal reason that direct

Q20: Sales commissions are an example of:<br>A) unit-level

Q21: Because volume-based allocation rates assign more cost

Q22: Select the correct statement regarding activity-based costing

Q23: As companies have become more highly automated,overhead

Examlex

ExamLex

About UsContact UsPerks CenterHomeschoolingTest Prep

Work With Us

Campus RepresentativeInfluencers

Links

FaqPricingChrome Extension

Download The App

Get App StoreGet Google Play

Policies

Privacy PolicyTerms of ServiceHonor CodeCommunity Guidelines

Scan To Download

qr-code

Copyright © (2025) ExamLex LLC.

Privacy PolicyTerms Of ServiceHonor CodeCommunity Guidelines