Multiple Choice
Figure 2-1 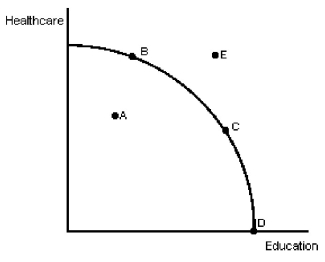
-In Figure 2-1,point D shows
A) the use of all resources to produce Health Care.
B) using some resources to produce Education and some to produce Health Care.
C) the use of all resources to produce Education.
D) some unemployed resources.
Correct Answer:

Verified
Correct Answer:
Verified
Q71: The fact that a country's production possibilities
Q72: Which of the following would cause an
Q73: The circular flow diagram shows that<br>A)firms are
Q74: Explain the difference between comparative advantage and
Q75: Figure 2-1 <img src="https://d2lvgg3v3hfg70.cloudfront.net/TB4981/.jpg" alt="Figure 2-1
Q77: Figure 2-1 <img src="https://d2lvgg3v3hfg70.cloudfront.net/TB4981/.jpg" alt="Figure 2-1
Q78: A society currently operating on its production
Q79: Figure 2-3<br>Tonnes<br>of<br>Soybeans <img src="https://d2lvgg3v3hfg70.cloudfront.net/TB4981/.jpg" alt="Figure 2-3 Tonnes
Q80: Specialization according to the principle of comparative
Q81: If output of a good or service