Multiple Choice
Figure 2-1 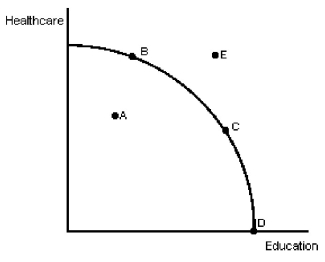
-In Figure 2-1,at point D,resource use is
A) less efficient than at point C.
B) more efficient than t point B.
C) less efficient than at point B.
D) more efficient than at point A.
Correct Answer:

Verified
Correct Answer:
Verified
Q72: Which of the following would cause an
Q73: The circular flow diagram shows that<br>A)firms are
Q74: Explain the difference between comparative advantage and
Q75: Figure 2-1 <img src="https://d2lvgg3v3hfg70.cloudfront.net/TB4981/.jpg" alt="Figure 2-1
Q76: Figure 2-1 <img src="https://d2lvgg3v3hfg70.cloudfront.net/TB4981/.jpg" alt="Figure 2-1
Q78: A society currently operating on its production
Q79: Figure 2-3<br>Tonnes<br>of<br>Soybeans <img src="https://d2lvgg3v3hfg70.cloudfront.net/TB4981/.jpg" alt="Figure 2-3 Tonnes
Q80: Specialization according to the principle of comparative
Q81: If output of a good or service
Q82: An economic system in which individuals own