Multiple Choice
Figure 6-1 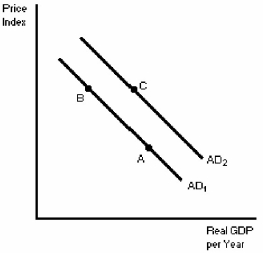
-In Figure 6-1,a movement from point B to point A can be explained by
A) an increase in spending due to a war.
B) an increase in spending due to increases in education expenditures.
C) an increase in the demand for manufacturing goods due to new technology.
D) a drop in the price level.
Correct Answer:

Verified
Correct Answer:
Verified
Q105: When the Federal government increases the level
Q106: What is the long-run aggregate supply curve?
Q107: A decrease in the price level will
Q109: The long-run aggregate supply curve is<br>A)horizontal at
Q110: If you have $1 000 and the
Q111: If the Bank of Canada were to
Q112: Higher interest rates<br>A)reduce the quantity of goods
Q113: Describe the three possibilities that occur when
Q114: The aggregate demand curve gives the<br>A)planned purchases
Q203: The real-balance effect shows that<br>A) aggregate demand