Multiple Choice
Refer to Infographic 7.What was the difference in the end of season crop yield (metric tons/ha) between the controlled drainage plot and the free drainage plot? 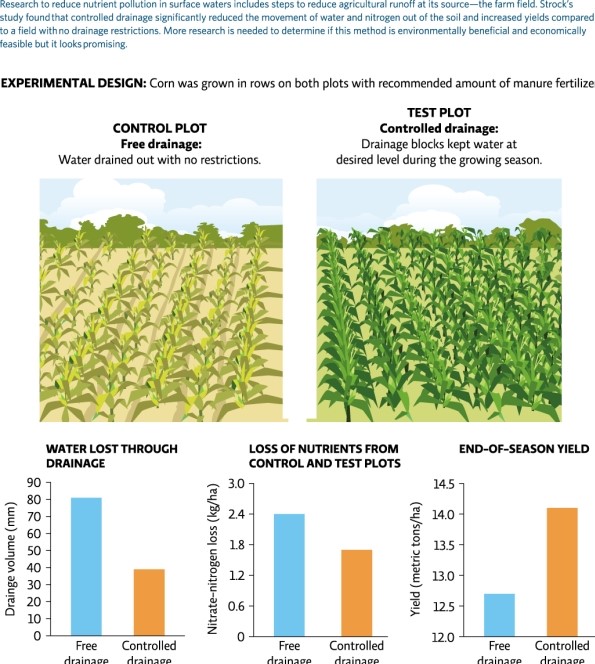
A) 12.7
B) 14.0
C) 13.0
D) 1.3
E) 26.7
Correct Answer:

Verified
Correct Answer:
Verified
Related Questions
Q63: If you wanted to check the water
Q64: Which is an example of a point
Q65: Discuss some ways that human alteration of
Q66: What is a dead zone?<br>A)waters so depleted
Q67: You are conducting a biological assessment on
Q68: Science Literacy Use Infographic 7 below to
Q69: Why are sources of point source pollution
Q70: Refer to Infographic 6.How much land,in feet,does
Q71: How can you explain to your neighbor
Q72: What is one method to determine how