Multiple Choice
Exhibit 5-1 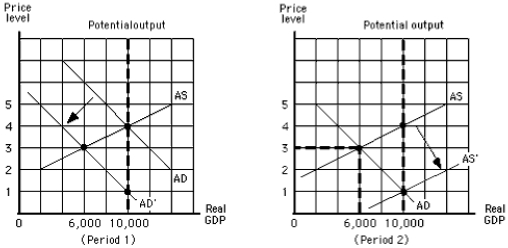
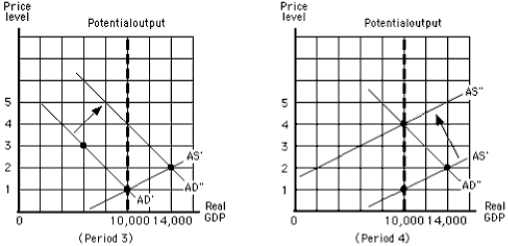
-Exhibit 5-1 shows that from the beginning of period 1 to the end of period 2,
A) real GDP decreased and then increased
B) real GDP increased and then decreased
C) real GDP fell from $10,000 to $6,000
D) real GDP rose from $6,000 to $10,000
E) the inflation rate fell from 4 to 1
Correct Answer:

Verified
Correct Answer:
Verified
Q55: As the price level increases,the amount of
Q56: An increase in aggregate supply will result
Q57: Between 1947 and 2003,U.S.real GDP<br>A)hardly changed at
Q58: Exhibit 5-2 <img src="https://d2lvgg3v3hfg70.cloudfront.net/TB4914/.jpg" alt="Exhibit 5-2
Q59: Exhibit 5-1 <img src="https://d2lvgg3v3hfg70.cloudfront.net/TB4914/.jpg" alt="Exhibit 5-1
Q61: Exhibit 5-3 <img src="https://d2lvgg3v3hfg70.cloudfront.net/TB4914/.jpg" alt="Exhibit 5-3
Q62: Between 1947 and 1998,total U.S.employment<br>A)remained about the
Q63: If business leaders become pessimistic about future
Q64: Given an aggregate supply curve that slopes
Q65: Which of the following was a central