Multiple Choice
Figure 5.1 shows the demand curve for a firm. In the figure below, the total revenue at point a is _____. Figure 5.1
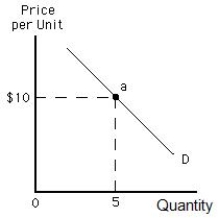
A) $4
B) $5
C) $10
D) $50
E) $100
Correct Answer:

Verified
Correct Answer:
Verified
Related Questions
Q23: Table 5.2 shows the change in the
Q30: If the price of Pepsi-Cola increases from
Q32: Figure 5.3 shows a linear demand curve.
Q42: As consumers have a longer time period
Q71: Table 5.2<br> <span class="ql-formula" data-value="\begin{array}{c}\begin{array}{lll}\\
Q86: As DVDs become popular substitutes for video
Q89: Both the income elasticity of demand and
Q112: Total revenue is the same for every
Q119: The percentage change in the demand for
Q152: If city officials expect that an increase