Multiple Choice
Figure 5.3 shows a linear demand curve. Between points C and D, the demand is:
Figure 5.3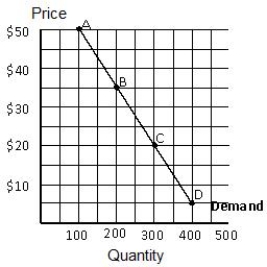
A) unitary.
B) elastic.
C) inelastic.
D) perfectly elastic.
E) perfectly inelastic.
Correct Answer:

Verified
Correct Answer:
Verified
Related Questions
Q22: The greater the availability of close substitutes
Q27: Figure 5.1 shows the demand curve for
Q30: If the price of Pepsi-Cola increases from
Q30: The price elasticity of demand for milk
Q34: Suppose the price elasticity of demand for
Q34: Total revenue is maximized where demand is
Q42: As consumers have a longer time period
Q42: Demand is more elastic _<br>A)in the short
Q112: Total revenue is the same for every
Q119: The percentage change in the demand for