Multiple Choice
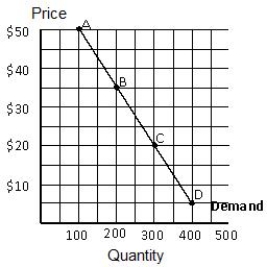
Figure 5.3 shows a linear demand curve. As you move from point A to point B along the demand curve, total revenue _____ and the demand is _____.
Figure 5.3
A) stays the same; unitary
B) decreases; inelastic
C) increases; elastic
D) increases; elastic.
E) increases, inelastic
Correct Answer:

Verified
Correct Answer:
Verified
Related Questions
Q2: Identify a statement that is true about
Q59: Along a linear demand curve, as the
Q89: If the income elasticity of demand for
Q131: Figure 5.4 shows a downward-sloping linear demand
Q132: If a firm facing a perfectly elastic
Q135: Table 5.6 shows the change in the
Q164: If income rises and the demand for
Q187: Inferior goods have an income elasticity of
Q197: If an increase in the price of
Q217: Wheat farmers in Kansas would benefit from