Multiple Choice
Figure 5.4 shows a downward-sloping linear demand curve. Between points b and c in the figure below, price decreases by $1, quantity demanded increases by 10, _____.
Figure 5.4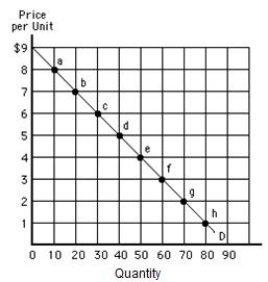
A) total revenue decreases by $1, and demand is elastic
B) total revenue decreases by $1, and demand is inelastic
C) total revenue increases by $40, and demand is elastic
D) total revenue increases by $40, and demand is inelastic
E) and total revenue increases by $80
Correct Answer:

Verified
Correct Answer:
Verified
Q59: Along a linear demand curve, as the
Q89: If the income elasticity of demand for
Q126: Figure 5.3 shows a linear demand curve.
Q132: If a firm facing a perfectly elastic
Q133: Figure 5.3 shows a linear demand curve.
Q135: Table 5.6 shows the change in the
Q136: The demand for flour is<br>A)inelastic because there
Q187: Inferior goods have an income elasticity of
Q197: If an increase in the price of
Q217: Wheat farmers in Kansas would benefit from