Multiple Choice
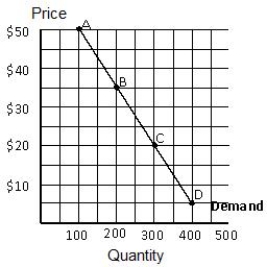
Figure 5.3 shows a linear demand curve. As you move from point B to point C along the demand curve, total revenue _____ and the demand is _____.
Figure 5.3
A) stays the same; unitary
B) decreases; inelastic
C) increases; elastic
D) decreases; elastic
E) increases, inelastic
Correct Answer:

Verified
Correct Answer:
Verified
Q25: Which of the following is a possible
Q29: When the cross-price elasticity of demand between
Q83: When agricultural production increases,the total amount paid
Q105: If the price elasticity of supply in
Q119: The price elasticity of demand helps determine
Q121: Figure 5.5 shows the total revenue curve
Q121: If people have more time to adjust
Q126: Figure 5.3 shows a linear demand curve.
Q136: The demand for flour is<br>A)inelastic because there
Q188: Demand for a necessity, such as food,