Multiple Choice
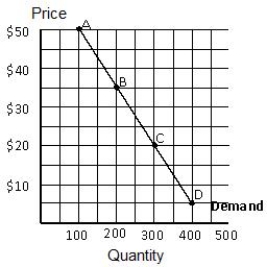
Figure 5.3 shows a linear demand curve. Between points A and B, the demand is:
Figure 5.3
A) unitary.
B) elastic.
C) inelastic.
D) perfectly elastic.
E) perfectly inelastic.
Correct Answer:

Verified
Correct Answer:
Verified
Related Questions
Q25: Which of the following is a possible
Q83: When agricultural production increases,the total amount paid
Q89: If the income elasticity of demand for
Q121: If people have more time to adjust
Q121: Figure 5.5 shows the total revenue curve
Q122: Figure 5.3 shows a linear demand curve.
Q131: Figure 5.4 shows a downward-sloping linear demand
Q136: The demand for flour is<br>A)inelastic because there
Q187: Inferior goods have an income elasticity of
Q197: If an increase in the price of