Multiple Choice
The figure below shows the cost and revenue curves faced by a monopolist. The profit-maximizing output and price for the monopolist are:
Figure 9.1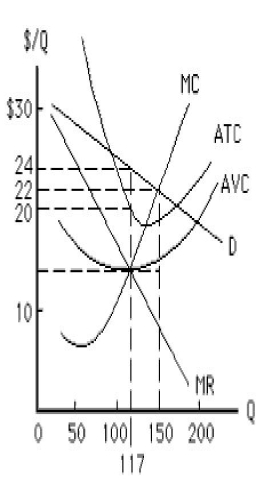
A) 117 units and $14, respectively.
B) 150 units and $22, respectively.
C) 150 units and $14, respectively.
D) 117 units and $22, respectively.
E) 117 units and $24, respectively.
Correct Answer:

Verified
Correct Answer:
Verified
Q7: When a price-discriminating monopolist divides its customers
Q43: A firm facing a downward-sloping demand curve
Q46: $0.Given the information in the table below,
Q47: The figure below shows the cost and
Q48: For which of the following products would
Q51: The figure below shows the cost and
Q52: The figure below shows the total cost
Q97: Unlike perfectly competitive firms,monopolists _<br>A)earn positive short-run
Q98: The profit-maximizing quantity for a monopolist that
Q152: A monopolist practices price discrimination by _<br>A)charging