Multiple Choice
The figure below shows the total cost and total revenue curves for a monopolist. The profit-maximizing output for the monopolist is:
Figure 9.3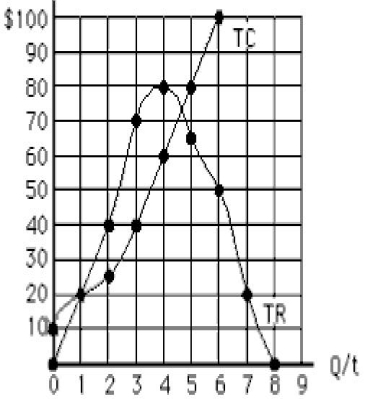
A) 1 unit
B) 2 units
C) 3 units
D) 4 units
E) 5 units
Correct Answer:

Verified
Correct Answer:
Verified
Q16: Price discrimination will occur whenever a firm
Q43: A firm facing a downward-sloping demand curve
Q47: The figure below shows the cost and
Q48: For which of the following products would
Q50: The figure below shows the cost and
Q51: The figure below shows the cost and
Q97: Unlike perfectly competitive firms,monopolists _<br>A)earn positive short-run
Q98: The profit-maximizing quantity for a monopolist that
Q152: A monopolist practices price discrimination by _<br>A)charging
Q163: A profit-maximizing monopolist supplies the quantity at