Multiple Choice
The figure below shows the cost and revenue curves for a non-discriminating monopolist. The total cost incurred by the monopolist at the profit-maximizing output is _____.
Figure 9.1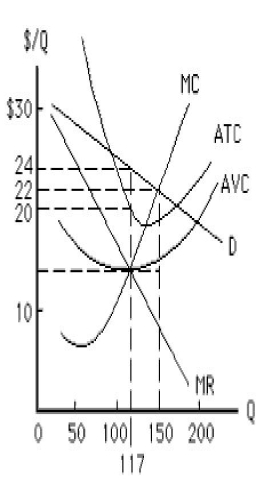
A) $3,300
B) $3,400
C) $2,808
D) $2,340
E) $1,638
Correct Answer:

Verified
Correct Answer:
Verified
Related Questions
Q18: For a monopolist producing a level of
Q59: The figure below shows the cost and
Q61: The figure below shows a non-discriminating monopolist.
Q64: The figure below shows the cost and
Q66: Barriers to entry:<br>A)cause monopolies to experience diseconomies
Q68: A monopolist that engages in perfect price
Q121: Total deadweight loss in society is reduced
Q138: For a monopolist that does not price
Q160: If a monopolist that does not practice
Q183: A monopolist maximizes profit at the output