Multiple Choice
The figure below shows the cost and revenue curves for a monopolist. The output level that maximizes profit for the non-price discriminating monopolist is _____.
Figure 9.6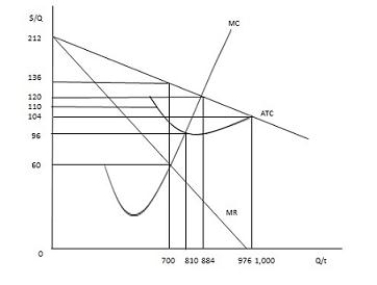
A) 700 units
B) 810 units
C) 884 units
D) 976 units
E) 1,000 units
Correct Answer:

Verified
Correct Answer:
Verified
Q16: Price discrimination will occur whenever a firm
Q18: For a monopolist producing a level of
Q61: The figure below shows a non-discriminating monopolist.
Q63: The figure below shows the cost and
Q64: The figure below shows the cost and
Q97: Unlike perfectly competitive firms,monopolists _<br>A)earn positive short-run
Q138: For a monopolist that does not price
Q152: A monopolist practices price discrimination by _<br>A)charging
Q163: A profit-maximizing monopolist supplies the quantity at
Q183: A monopolist maximizes profit at the output